
Harnessing the solar potential of schools to combat climate change

Find your school!
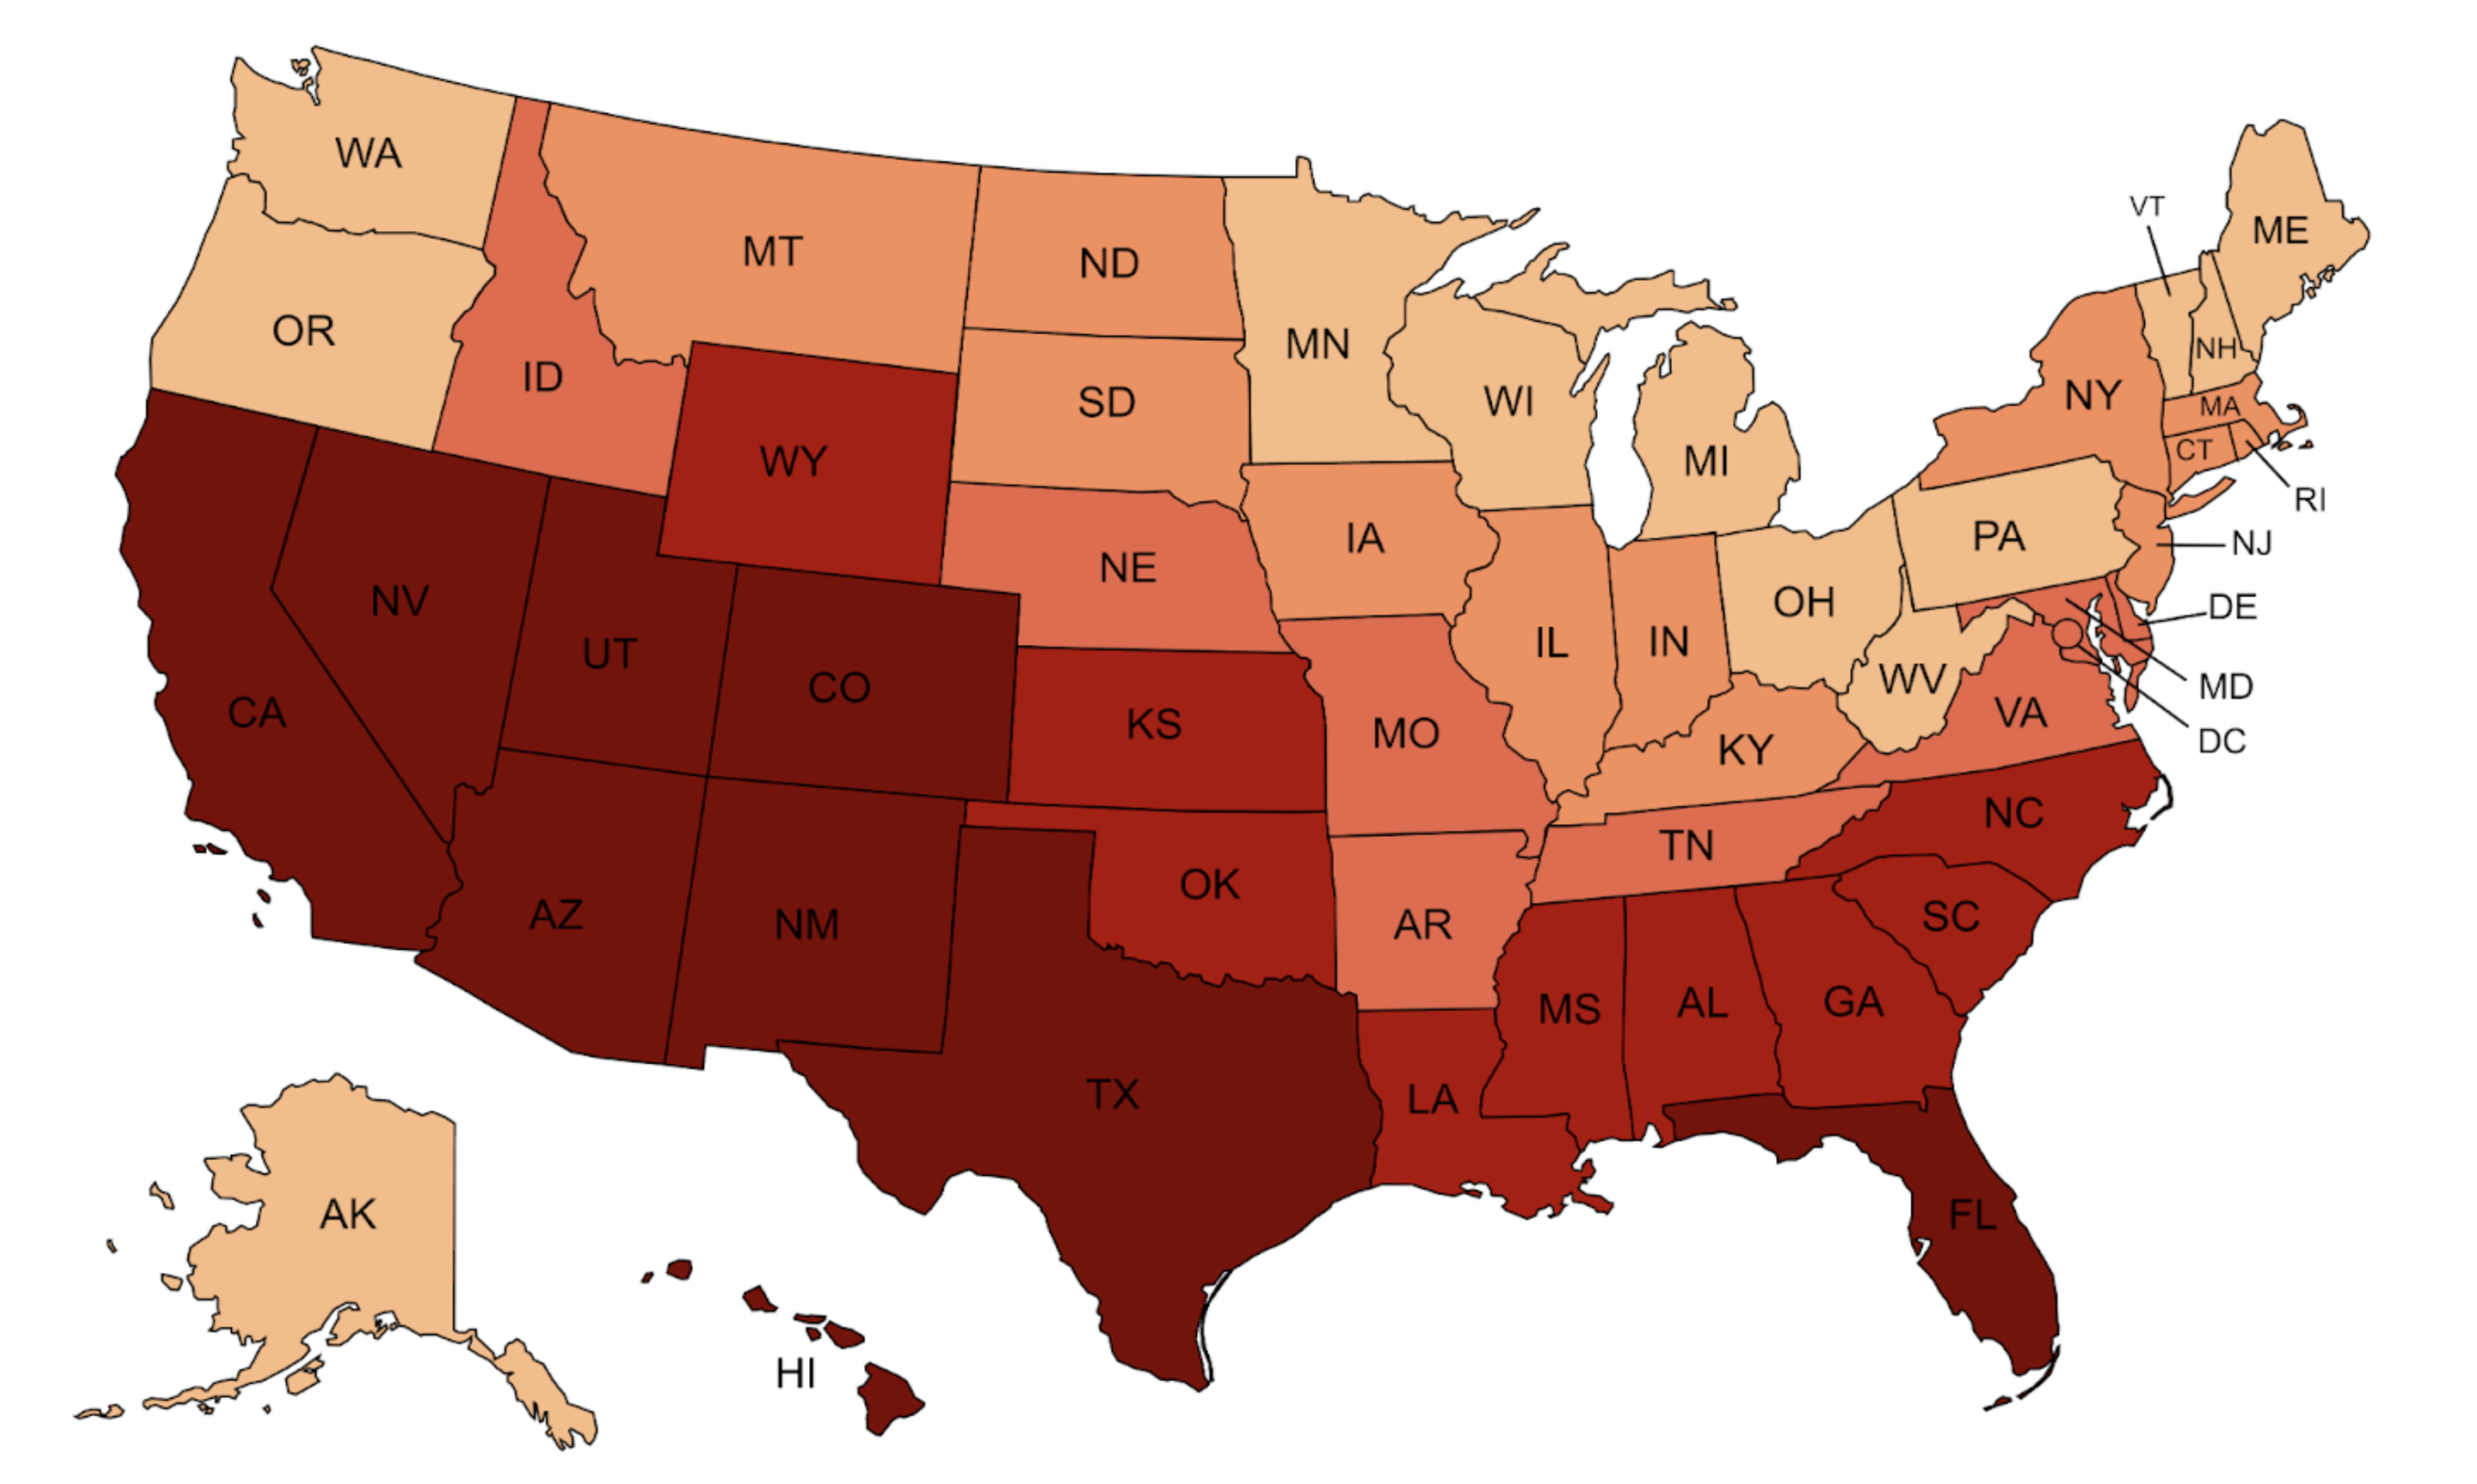
Schools across the US possess a wide range in solar efficiency. For the same 1MWp solar array, the photovoltaic output can be as high as 1,745 MWh/year in the Mojave desert in California… and as low as 715 MWh/year on the Aleutian Islands in Alaska.
Curious where your school fits into this range? Search it up to see how it stacks up.
Explore the dataset
Solar efficiency depends not only on latitude but also on the larger geographical and average weather patterns. After factoring in these components, the top 5 states by solar efficiency are:
Arizona
New Mexico
Nevada
California
Hawaii
What is fascinating is that the actual installations don’t correlate with ideal efficiency. States such as New Jersey and Illinois have more solar schools than Arizona pointing to the huge effect of state-level policies on driving installations.
As decisions to “go solar” are influenced by state level policies, we can consider the impact if all the schools in the state were to install solar arrays. Top 3 states by TOTAL solar potential are as follows - these states have large populations (and therefore lots of schools) as well as ideal solar conditions:
California
Texas
Florida
See the state directory to find the best zip codes and top schools in your state.

Methodology
Creating a new dataset - ranked list of all schools by their solar potential - was an exciting endeavor. There were quite a few dead-ends and some well-crafted resources that I could build upon.
The process required bringing together multiple sources:
Database of 124,000+ private and public schools in the US
Global Solar Atlas to find the potential at various latitude and longitude
and learning new tools such as Javascript, Node.js, REST APIs and using professional tools such as Tableau, Squarespace and Sheet2Site.

Economic Analysis
Energy represents nearly 3/4 of global greenhouse emissions. So, we need to start with energy production. Over the last decade, solar has gone from the most expensive to the least expensive means to generate electricity. Economics dictates that the cost will continue to go down as deployment increases.
The use of Power Purchase Agreements makes it very cost-effective (even free for schools) to install solar panel arrays and creates a new revenue source to fund more school programs - an encouraging prospect! However, the process for installing solar roofs is done in a patchwork manner, with each school district doing its own analysis and striking a deal with an installation company.
My analysis shows that by installing 1MWp solar arrays at all the schools, we can generate 163 billion kWh / year. This would represent an increase in solar energy production by 285%, and increase contribution of photovoltaic sources from 2.2% of total energy production to 4%.
Our goal should be to act with urgency in order to ensure the global temperatures don’t rise by more than 1.5 C. In my view, it would be much better if the decision to install solar arrays at schools were done at an entire-state level. Doing so would reduce bureaucracy, reduce overall project costs, reduce time and create lots of steady jobs - all without adding taxes.