Average solar potential, by state
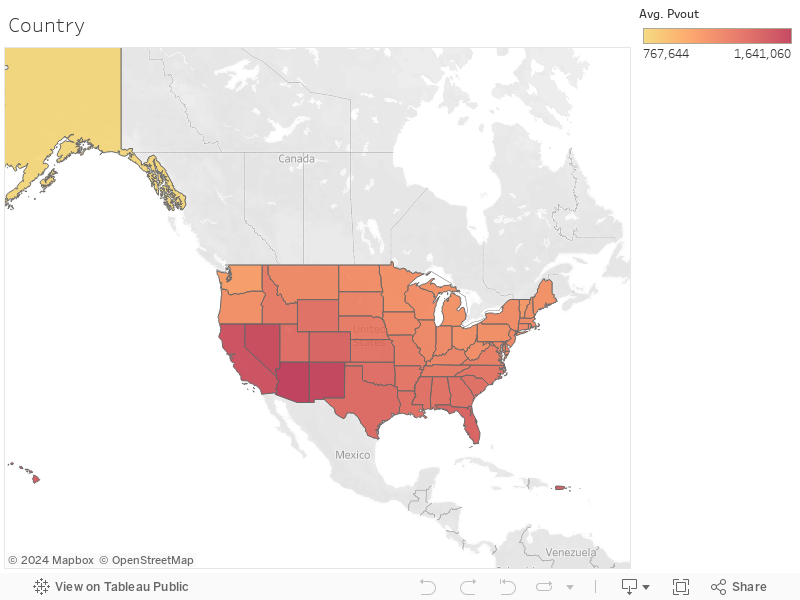
Hover over each state to see the photo-voltaic output (PVOUT) in KWh/year, a measure of the electrical energy generated, of a 1 MWp solar panel array installed in a school within that state.
Dark-red colored states have higher PVOUT values and correlate to ideal regions for solar panels. These regions often have higher elevation, more exposure to sunlight, and latitude values closer to the equator. Solar arrays in these locations will outperform those placed in yellow or orange colored zip codes.
Top 5 states by solar efficiency are Arizona, New Mexico, Nevada, California and Hawaii

States are ranked by the solar efficiency of 1 MWp solar panel array installed in that state. Values are the average of Solar efficiency across all schools in that particular state. Therefore, number of schools in that state does not effect the value.
Top 3 states by total solar potential are California, Texas and Florida

States are compared by the total solar output generated if every school in the state installed a 1 MWp solar panel array. As decisions to “go solar” can be influenced by state level policies, incentives in top-ranking states on this list can make an outsized impact.
Top 10 schools for going solar
Schools are sorted by solar potential. The schools below are the best candidates in the state for installing (or expanding) solar panel arrays. It is fascinating to see that all 10 schools are in California!
| Rank | School | Address | Solar Potential (MWh/year) |
| 1 | BALDY MESA ELEMENTARY | 10376 BALDY MESA RD. PHELAN, CA 92329 | 1745.23 |
| 2 | WRIGHTWOOD ELEMENTARY | 1175 STATE HIGHWAY 2 WRIGHTWOOD, CA 92397 | 1745.06 |
| 3 | QUAIL VALLEY MIDDLE | 10058 ARROWHEAD RD. PHELAN, CA 92371 | 1744.63 |
| 4 | EAGLE SUMMIT COMMUNITY DAY | 3919 NIELSON RD. PHELAN, CA 92371 | 1744.59 |
| 5 | YUCCA MESA ELEMENTARY | 3380 AVALON AVE. YUCCA VALLEY, CA 92277 | 1744.45 |
| 6 | PHELAN ELEMENTARY | 4167 PHELAN RD. PHELAN, CA 92371 | 1744.04 |
| 7 | CHAPARRAL HIGH | 9258 MALPASO RD. PHELAN, CA 92329 | 1743.66 |
| 8 | SERRANO HIGH | 9292 SHEEP CREEK RD. PHELAN, CA 92329 | 1743.61 |
| 9 | SNOWLINE VIRTUAL | 9298 SHEEP CREEK RD. PHELAN, CA 92371 | 1743.44 |
| 10 | PINON MESA MIDDLE | 9298 SHEEP CREEK RD. PHELAN, CA 92329 | 1743.42 |
State and local policies are driving solar installations in schools

Generation180 is a non-profit that tracks solar schools across the US. According to their “Brighter Future” report, published in Sept 2020, we have the following data about the current state of solar in schools for the top 5 states. Hawaii is doing an amazing job with 29% of their schools “going solar”. Whereas New Mexico has a long way to go with only 5% of their schools being solar, despite high solar efficiency. Nationally, only 5.5% of schools have gone solar, so there is 94.5% of the way to go still!
| State | Number of Solar schools | Total number of schools in state | Percent of Solar schools |
| Arizona | 400 | 2,741 | 15% |
| New Mexico | 49 | 1,052 | 5% |
| Nevada | 176 | 852 | 21% |
| California | 2430 | 12,917 | 19% |
| Hawaii | 117 | 401 | 29% |
What is fascinating is to look at the top 10 states, ranked by number of solar schools. While we see Arizona and California on the list, we also see states in the bottom half by solar efficiency featuring in the top 10. This disparity between “ideal” (how we might install solar panels, all things being equal) and “actual” (where solar is installed in schools) points to the huge effect that state-level policies and incentives have on adoption of this technology.
| State | Number of Solar schools | Solar efficiency rank |
| California | 2,430 | 4 |
| New Jersey | 621 | 32 |
| Illinois | 455 | 33 |
| Arizona | 400 | 1 |
| Massachusetts | 292 | 38 |
| Florida | 280 | 7 |
| New York | 260 | 39 |
| Connecticut | 205 | 35 |
| Maryland | 184 | 29 |
| Nevada | 176 | 3 |
Explorer by State and Territories: