Method
My goal is to generate a dataset of the solar potential across all the schools in the US. Below is the step-by-step walkthrough of the method.
1 - First-principles calculation of solar radiation
I started by figuring out a way to calculate the amount of solar radiation at a particular school. The input parameters are:
School’s latitude as that would determine the sun’s position in the sky and
The angle at which the solar panels are placed
Ideally, the solar panels would track the sun keeping the panels at 90 degrees to the sun for maximum efficiency (like a sunflower). However, that would require motors and controllers which would add cost and need energy and maintenance to operate. I observed that most school, home and commercial installations were fixed in place. So, I decided to keep it simple as well and assume that panels would be fixed, facing south at an angle of 10-15 degrees.
After studying websites on photovoltaics (technical terms for solar power), I found PVeducation.org to explain the physics behind solar power the best.

\( \alpha \) is the angle of the sun at a particular time in the day. It is computed as:
$$ \alpha = 90 - \phi + \delta $$
where \( \phi \) is the latitude and \( \delta \) is the declination and computed as:
$$ \delta = 23.45^{\circ} \sin \left[ \frac{360}{365} (d - 81) \right] $$
where \( d \) is the day of the year from 0 to 365. The \( 81 \) accounts for counting from the Spring equinox (around March 20) when the Earth's axis is tilted neither toward nor away from the sun.
\( \beta \) is the tilt angle of the solar panels from horizontal position, and set at 10 degrees.
\( S_{incident} \) is the amount of solar radiation measured perpendicular to the sun. It is measured at \( 1367 W / m^2 \) (per source).
\( S_{module} \) is the radiation incident on a tilted solar panel array, and can be computed as:
$$ S_{module} = S_{incident} sin (\alpha + \beta) $$
As the position of the sun varies during the day (from sunrise to sunset) as well as during each day of the year (highest in the summer and lowest in the winter), I divided the year into 1-hour chunks and computed the position of the sun using the following equations:
\( H \) is the hour angle at sunrise and sunset and can be computed as:
$$ H = \arccos \left[\frac{ \sin(-0.83^{\circ}) -\sin \phi \sin \delta } {\cos \phi \cos \delta }\right] $$
As earth’s angular velocity is \( 15^\circ / hour \) (as it makes a complete revolution of \( 360 ^ \circ \) in \( 24 \) hours), we can convert from hour angle degrees to time as follows:
$$ sunrise = 12 - H / 15 $$
$$ sunset = 12 + H / 15 $$
For my elementary school, Springer Elementary, located at \( (37.3713, -122.0952) \) latitude and longitude, the above equations yield the value of:
Total Incident Solar Radiation = \( 2988.47 Wh / m^2 \) per year
Total Solar Radiation on 10 degree tilted Solar array = \( 2634.74 Wh / m^2 \) per year
2 - List of all schools in the US
In order to compare solar power potential across different schools, I needed a dataset of all schools that is:
Comprehensive - listing all public as well as private schools
Containing Latitude and Longitude
Free to download and use
After researching (and rejecting paid sources), I found the dataset from Department of Homeland Security’s Open Data site to be the most suitable:
https://hifld-geoplatform.opendata.arcgis.com/datasets/public-schools/data - containing 102,334 public schools
https://hifld-geoplatform.opendata.arcgis.com/datasets/private-schools/data - containing 22,615 private schools
This is a wonderful resource and I could download a CSV file that could be input into programs.

3 - Calculating annual solar radiation at a school
I used Javascript and the Node.js environment to write a computer program to calculate the amount of solar radiation for each school in the 124,000+ school database.
Click on the image below to check out the code:

4 - Effect of atmosphere and geography
You will notice that the first-principles calculation only considers the latitude of a school. This calculation is good for measuring the solar radiation hitting the earth’s upper atmosphere. But, for computing solar radiation on the ground, two more effects need to be considered:
Effect of atmosphere
Effect of geography - topography, temperature, altitude, etc.
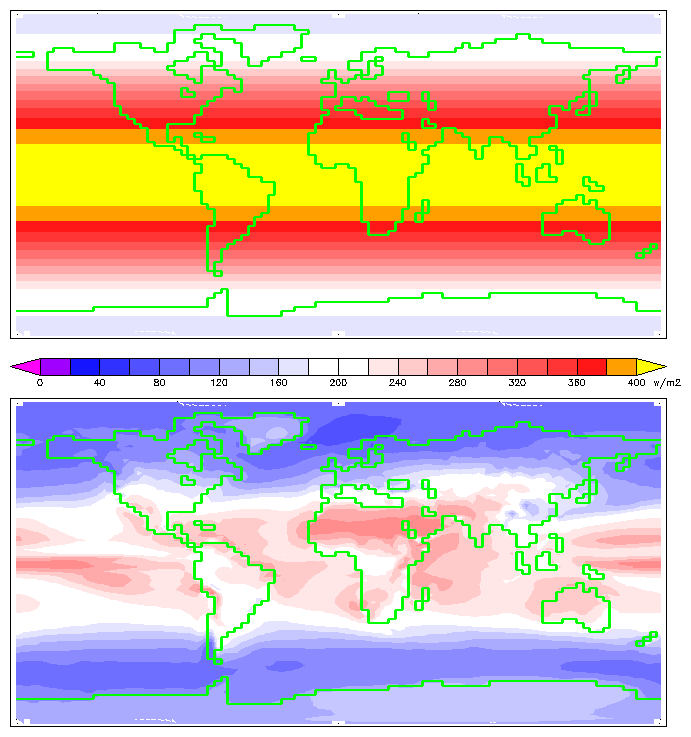
So, what I have calculated so far is the annual mean solar irradiation (or insolation) at the top of Earth's atmosphere (top image below).
What needs to be added is what is called “the shield effect” of Earth's atmosphere on solar irradiation. The bottom image shows the annual insolation reaching the Earth's surface after passing through the atmosphere.
Note that the two images use the same color scale. Source: William M. Connolley using HadCM3 data.
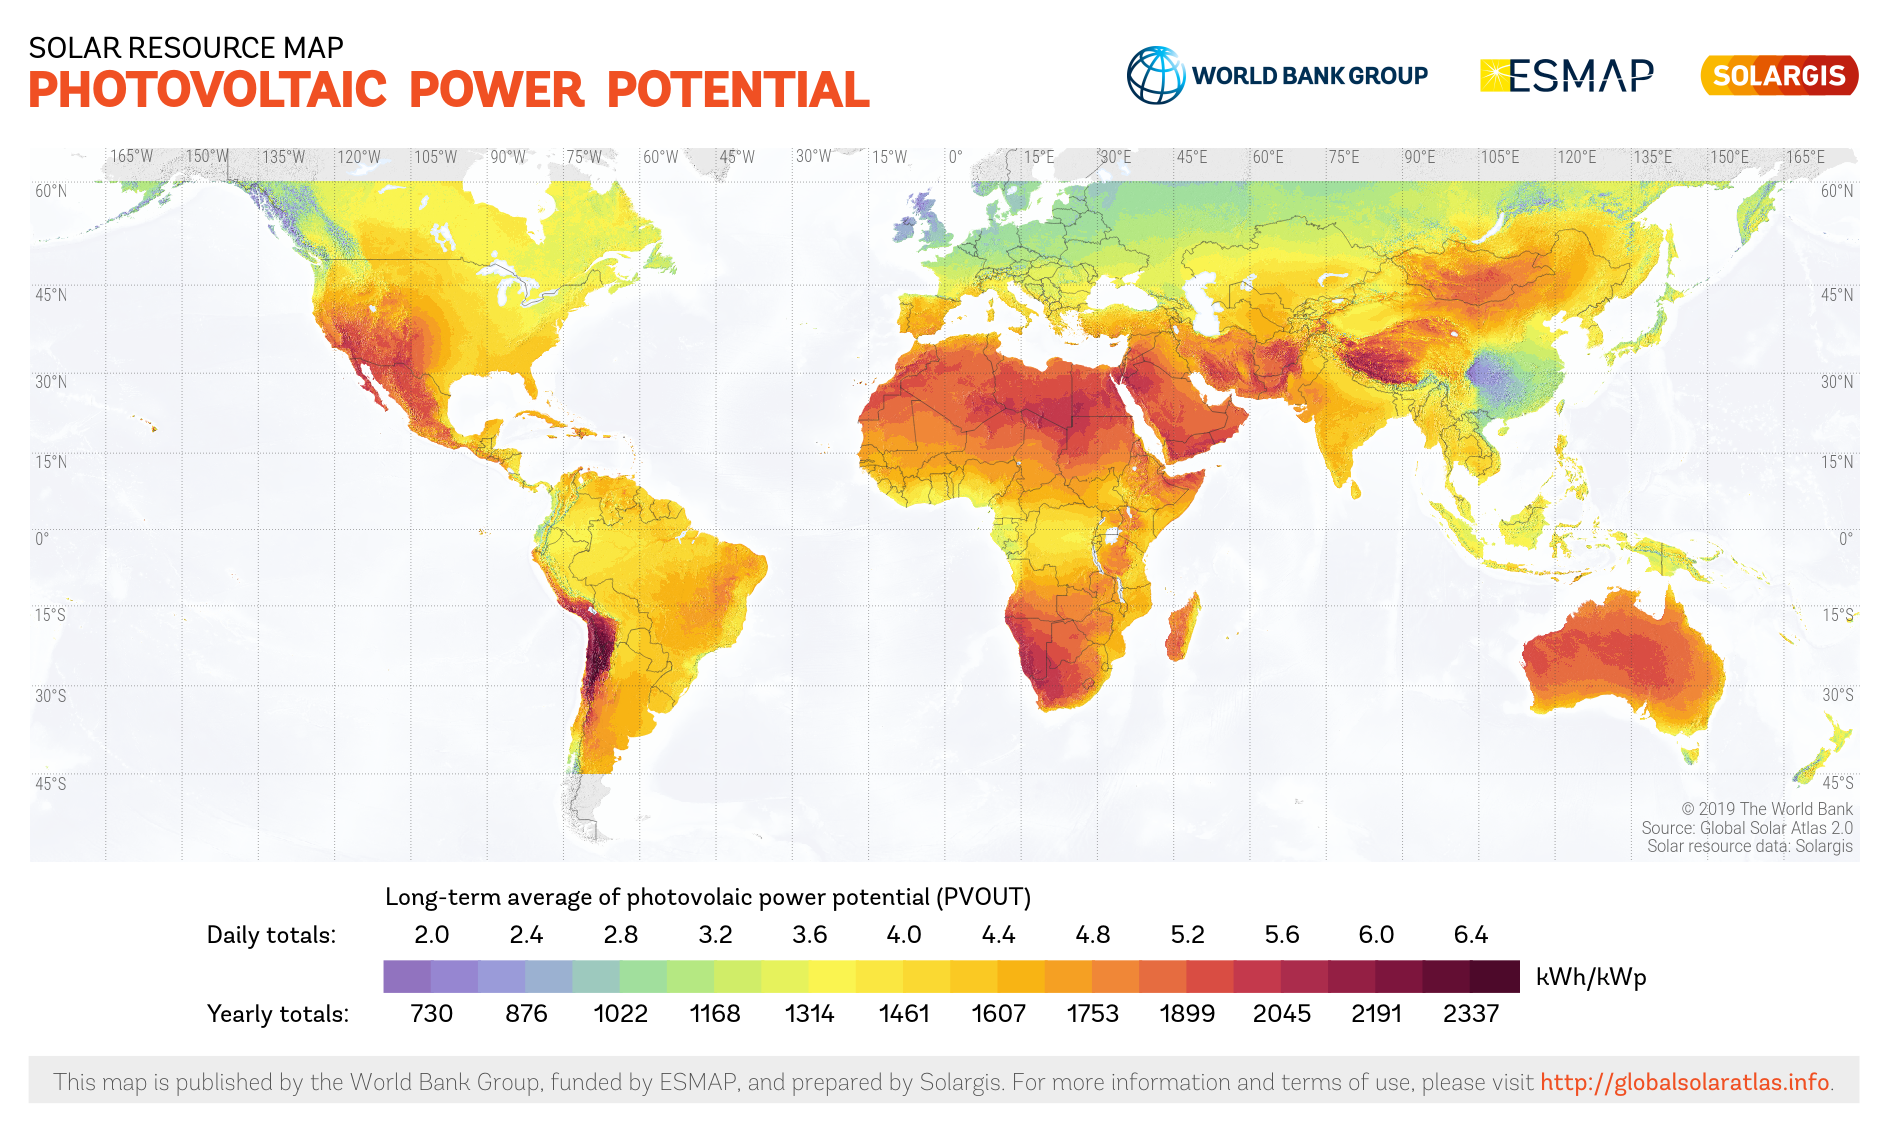
5 - Global Solar Atlas
Incorporating the effects of atmosphere and geography meant moving beyond first-principles modeling. After a fair bit of research, I concluded that Global Solar Atlas (https://globalsolaratlas.info/) was the best dataset. It is built by Solargis and funded by the World Bank as a resource for all countries to “support the scale-up of solar power”.

The site allows the user to enter a specific location. For my elementary school, it shows:
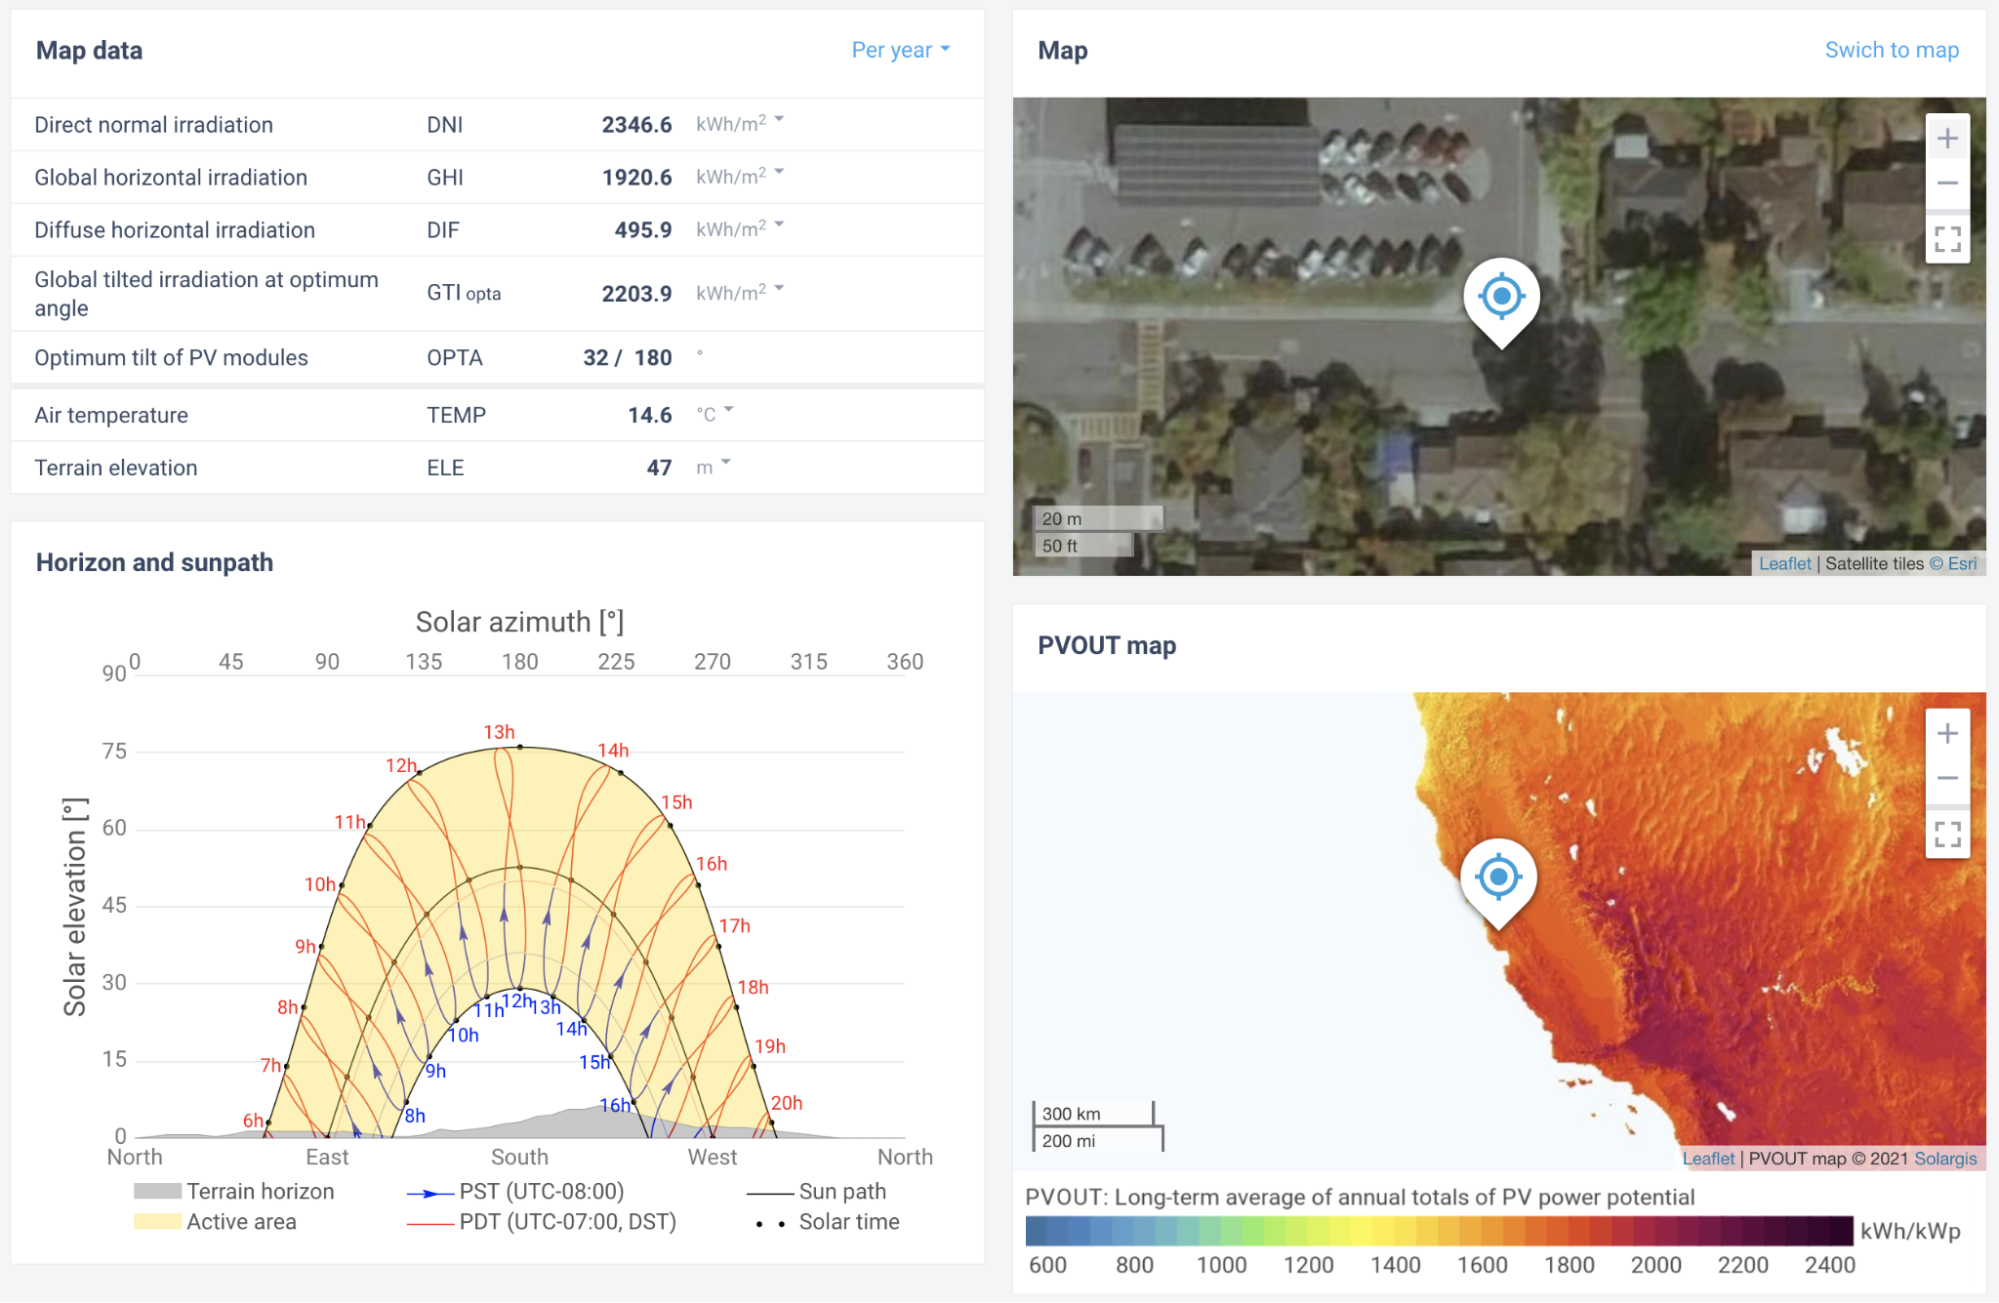
Some interesting things to point out:
Really striking to see how much more light we get in the summer vs the winter. Solar elevation gets to 75 degrees in the summer whereas it doesn’t even get to 30 degrees in the winter.
The optimal angle of solar panels is 32 degrees
The Santa Cruz mountains are in the SW direction. It’s cool to see the program take them into account.
6 - Schools should aim at becoming 1MW generators!
For estimating the solar potential, I need to estimate the number of solar panels at the site. The total installed capacity across 9 schools in my school district is 1.4MW or 0.16 MW per school roughly. As you can see on the satellite photo, the solar canopy is only over half the parking lot. While this is good, it’s not nearly enough! All the buildings are basically uncovered - there can be 6x more panels that can cover the full parking lot and the buildings, which would yield almost 1 MW.

Below is the satellite view of Reed High School in Reno, Nevada that has a 1MW solar panel array. I visited the school during a ski trip and it seemed totally normal and doable for other schools…

Ground view of 1 MW solar panel array at Reed High School:

Given that some schools might be installing solar panels as a symbolic gesture, I think 1 MW is the right target that most schools should attempt to hit!
7 - Calculating the solar potential of 1MWp solar array
The Global Solar Atlas site allows users to model different systems. Using the assumption of 1MWp solar array installed at 10 degrees yields the following result:
1555 MWh / year of solar power output
2065 KWh / m^2 per year of Global radiation (direct + diffuse) on tilted surface

Next, I automated this calculation for all schools in the US. Here, I got help from my dad who helped me discover that there is an undocumented REST API. He also helped me turn my one-school-at-a-time program into an asynchronous program so that schools could be processed in batches of 100 at a time.
At this point, I have a data-set that looks like:
Name,Address,City,State,Zip,Latitude,Longitude,PVOUT,GTIMONTESSORI SCHOOL OF PALM SPRINGS,3692 E CHIA RD,PALM SPRINGS,CA, 92262,33.841823561,-116.506504363,1694437.9777940926,2349.268632633834RAINBOW SCHOOL,11860 ROJAS DR,EL PASO,TX, 79936,31.72930976,-106.30660676,1711896.0395236588,2348.172209496066
8 - Visualize using Tableau
In order to visualize the data, I tried a set of programs. I turned to Tableau as they had a very easy way to see data geographically. Fortunately, that they have a student license that allows for free use for a year.
It’s also really cool that charts are interactive and anyone on the website can hover over a zip code and zoom into the data.
For each state, I generated 3 sets of graphs:
Average solar potential - showing solar power potential of placing a 1 MWp solar array
Number of schools - showing density of schools
Total solar potential - showing the effect if all the schools in that zip code installed 1 MWp solar array
Plus, I generated a top 10 list to motivate students in those schools to mobilize and talk to their parents and school administration.
